You Don't Have a Traffic Problem. You Have a Conversion Problem
Ad costs jumped 38% in a year while the average store converts just 1.4% of visitors. Five conversion rate fixes that beat buying more traffic.
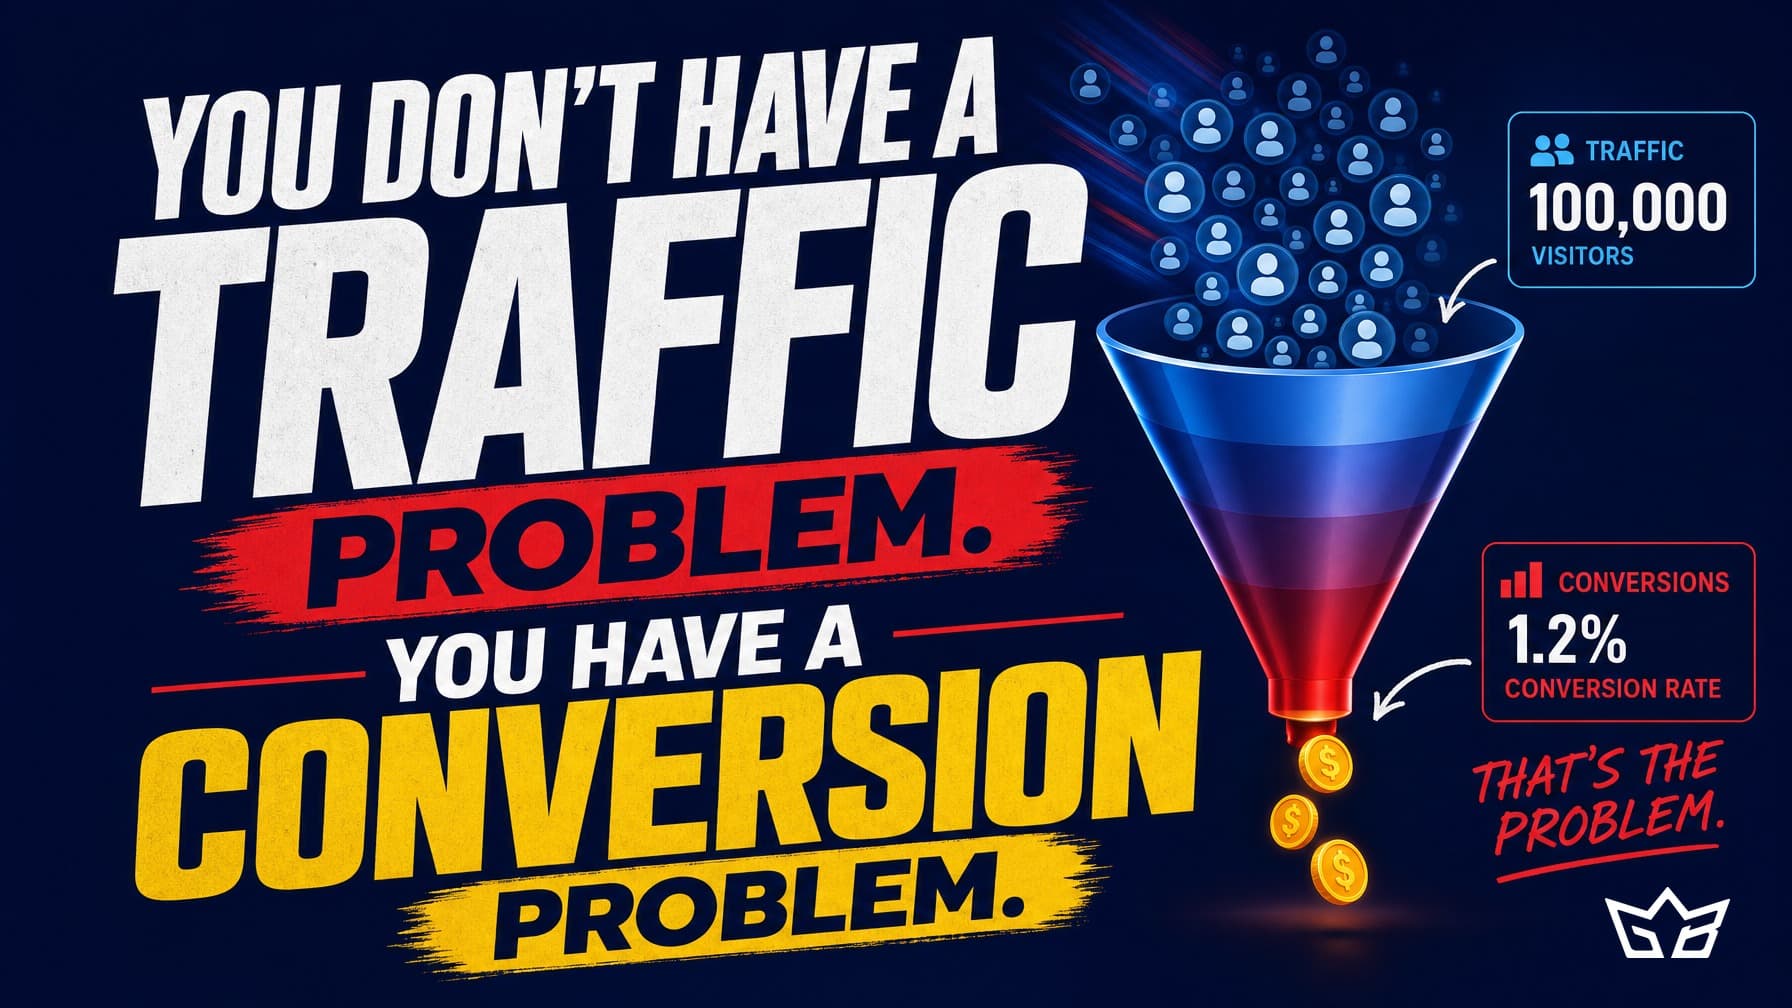
Your store already gets enough traffic to double your revenue. You just can't see it, because your conversion rate lets 97 out of every 100 visitors walk out without buying, and your answer so far has been to pay for more visitors.
That instinct is understandable. Traffic feels like the problem because traffic is the number you watch. But the data says you're solving the wrong equation, and every month you keep solving it, the wrong equation gets more expensive.
The Math Nobody Runs Before Buying More Traffic
Here's what paid traffic costs right now. Meta's average cost per acquisition jumped 38.1% in a single year, from $27.66 to $38.19. CPMs on Meta rose 20% over the same period. On Google, cost per click went up for 87% of industries last year, with the overall average climbing 12.88%. There is no version of 2026 where clicks get cheaper.
Now look at the other side of the ledger. The average Shopify store converts 1.4% of its visitors. The top 20% convert at 3.2% or higher. The top 10% clear 4.7%. That gap is not a traffic gap. Those stores aren't buying better clicks. They're keeping more of the clicks everyone already pays for.
Run both scenarios for a store doing 50,000 visitors a month at a 1.4% conversion rate and an $80 average order:
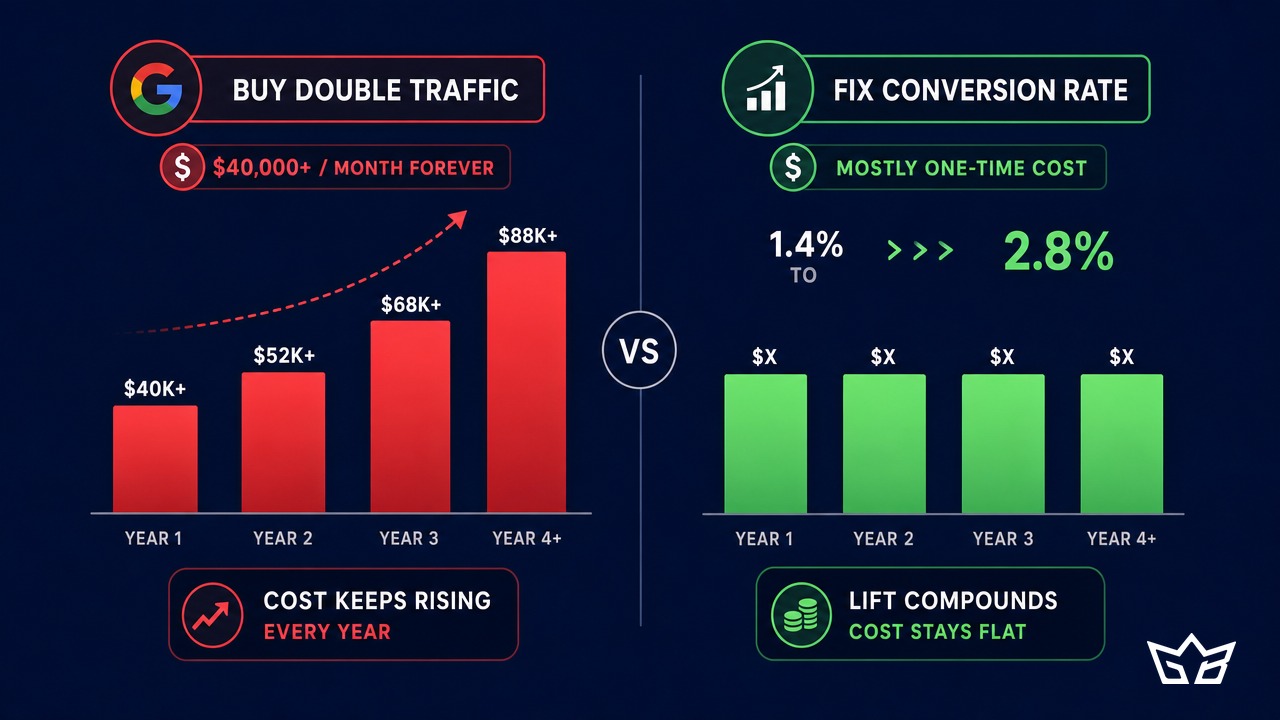
Same revenue outcome. One of them you rent. The other you own.
And the conversion path pays twice, because a store that converts at 2.8% instead of 1.4% just cut its effective cost per acquisition in half. Every ad you run after the fix works twice as hard. This is why companies that invest in conversion optimization report an average ROI of 223%. The fix applies to all traffic, from every channel, forever.
Why the Traffic Habit Is So Hard to Break
If conversion work has better math, why does everyone default to buying traffic? Because the ad platforms have trained you well.
Traffic is visible. You spend $1,000, you watch sessions climb the same day, and the dashboard congratulates you. Conversion work is quiet. Nobody gets a dopamine hit from removing a form field.
Traffic also has a sales team. Meta and Google spend billions making it effortless to give them money. Your checkout flow has no sales team. No one emails you when your shipping cost reveal is killing 48% of your carts.
We've seen this play out with dozens of clients: the store owner who "needs more traffic" almost always has a leaky funnel that would make any new traffic more expensive than it looks. Pouring water into a cracked bucket doesn't fix the bucket. It just gets the floor wet faster.
Where Your Visitors Actually Leak Out
The leaks are not mysterious. They're measured, published, and depressingly consistent year after year. The average cart abandonment rate in 2026 sits at 70.22%. Seven out of ten shoppers who added a product to their cart, the hardest part of the whole journey, left before paying. Here's why they go:
- 48% abandon because of surprise costs. Shipping, taxes, and fees that appear late in checkout are the single biggest conversion killer in ecommerce.
- 26% abandon because you forced them to create an account. They wanted to buy. You made them fill out a registration form instead.
- 22% abandon because checkout was too long or complicated. Every extra field is a toll booth.
- 57% of consumers leave if pages load slowly. They're gone before your hero image finishes rendering.
Then there's mobile, where the numbers get worse. Mobile drives 65-75% of traffic for most stores but converts at roughly half the desktop rate: 1.8-2.5% versus 3.5-4%. Mobile cart abandonment hits 85.65%. Most stores are effectively running two businesses: a decent desktop store and a mobile store that leaks like a sieve, and the leaky one gets three-quarters of the visitors.
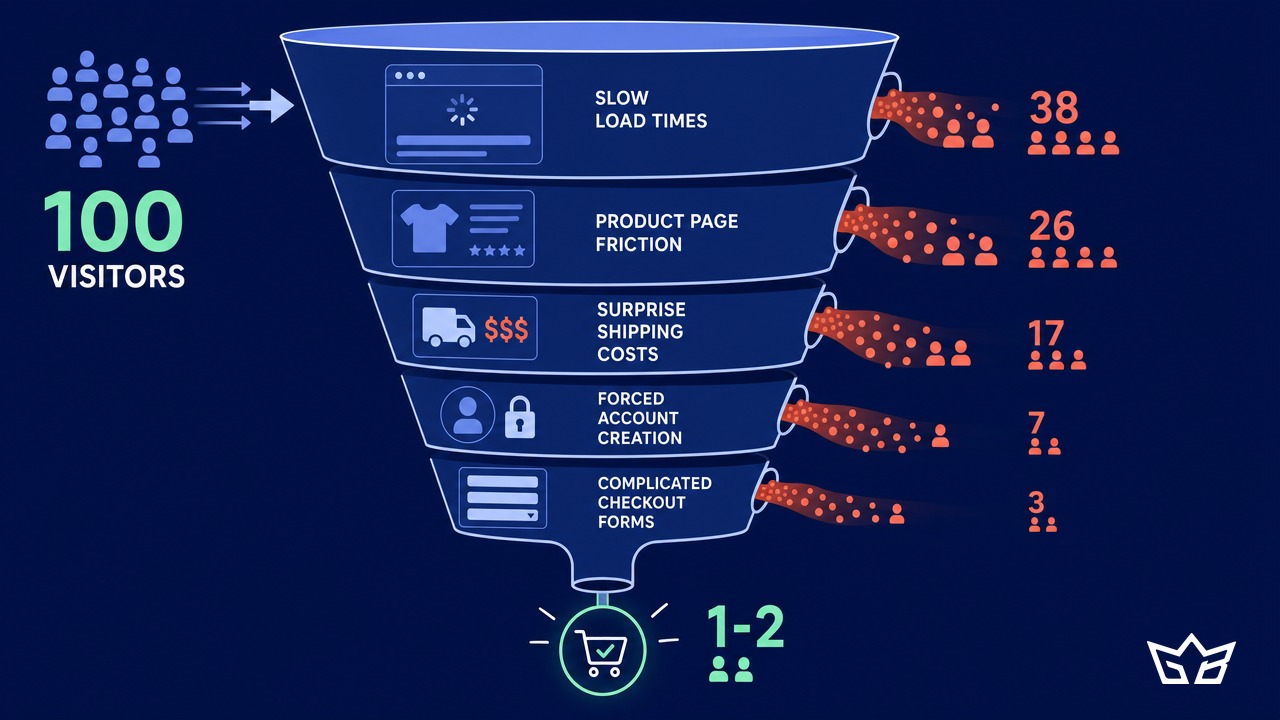
The upside hiding in those numbers: Baymard Institute's research shows the average large ecommerce site can lift conversions by around 35% through better checkout design alone. Not a redesign. Not a replatform. Checkout design.
Five Conversion Fixes, Ranked by Effort vs. Payoff
You don't need a six-month CRO roadmap to start. You need to fix the leaks in order of impact. Here's the sequence we run, cheapest first:
- Show total cost early. Put shipping costs on the product page or add a shipping calculator to the cart. You're attacking the 48% leak with an afternoon of work.
- Turn on guest checkout. If your platform supports it, this is a settings change that addresses a 26% leak. Offer account creation after the purchase, when the customer has already gotten what they came for.
- Cut your checkout to the bone. Count your form fields. The best checkouts ask for 6-8; the average asks for double that. Kill every field you don't strictly need to ship the order.
- Fix mobile speed. Compress images, kill render-blocking scripts, and test on a mid-range phone over 4G, not your flagship on office Wi-Fi. With 57% of shoppers bailing on slow pages and three-quarters of your traffic on mobile, this is where the compounding lives. Most stores fail Core Web Vitals without knowing it.
- Capture emails before visitors leave. Returning visitors convert at 4.5-6%, triple the rate of first-timers, and email traffic converts at 4-5.3%, the highest of any channel. A well-timed email capture turns today's bounced visitor into next month's high-converting one.
Notice what's not on the list: new themes, rebrands, AI chatbots, more ad spend. Those all have their place. None of them beats plugging a measured leak.
The one-question audit: Open your store on your phone right now and buy something, start to finish, like a stranger would. Time it. Count every screen, every field, every surprise. If you wince at any point, that wince is costing you a percentage of revenue that no ad budget can buy back.
The Objections We Hear Every Time
"But my traffic is organic. It's free." Free to acquire, expensive to waste. Organic visitors leak out of the same holes paid ones do, and organic search is not the renewable resource it used to be. AI answers are absorbing clicks that used to reach websites, which means every organic visitor who does land on your store is more precious than they were a year ago. Wasting 97% of a shrinking stream is worse than wasting 97% of a growing one.
"I'll deal with conversion after the busy season." It's July. Black Friday is in 22 weeks, and the stores that posted record numbers last year spent their summer fixing exactly these leaks, because none of them can be fixed under peak load. A checkout that loses a quarter of its carts to surprise shipping costs in July will lose them in November too, except in November each lost cart costs more, since holiday CPCs spike and every visitor arrives with money already in hand.
"My niche just converts low." Sometimes true. Luxury and jewelry convert at 0.8-1.2% and no checkout tweak changes what a $3,000 purchase decision feels like. But benchmark against your own industry before accepting your number. If apparel stores average 2-3% and yours converts at 1.1%, the niche isn't the problem.
The Testing Trap: How to Tell If Any of This Worked
A warning before you start changing things: most conversion tests lose. Across published industry data, only 15-33% of A/B tests produce a statistically significant win. That's not a reason to skip testing. It's a reason to test the big, well-documented leaks first instead of debating button colors.
Three rules keep you honest:
- Measure revenue per visitor, not just conversion rate. A change that lifts conversions but tanks average order value is a loss wearing a win's clothes.
- One change at a time on high-traffic pages. Stack three changes at once and you'll never know which one moved the number.
- Let tests run to significance. Calling a winner after four days of noise is how stores end up "optimizing" themselves backwards. Winning experiments deliver a median lift of about 2.77% in revenue per visitor, and those small wins stack. A store that lands one modest win a month compounds into a different business by next July.
If your traffic is too low to run clean A/B tests (under roughly 10,000 sessions a month), skip the testing theater. Make the five fixes above sequentially, watch your weekly conversion rate and revenue per visitor, and compare four weeks before against four weeks after. Imperfect measurement of a real fix beats perfect measurement of nothing.
Your 15-Minute Homework
Before you approve another dollar of ad spend, do this today:
- Pull up your analytics and write down three numbers: monthly sessions, conversion rate, and average order value.
- Calculate what a 0.5 point conversion lift would be worth per month. For most stores doing 30,000+ sessions, it's a number that will annoy you.
- Do the phone test from the audit box above. Buy from your own store like a stranger.
- Fix the first thing that made you wince.
That's it. Not a strategy deck. One measured leak, plugged this week.
And if you'd rather have someone run the full diagnostic, that's literally what we do. GrowthBoss runs conversion audits that map every leak in your funnel against the benchmarks in this post and hands you the fix list ranked by payoff. Your traffic is already paid for. Let's make it count.
Reviewed by Bahaa Zuraik under our editorial policy.