Your Store Has Revenue but No Profit. Here's Where the Money Leaks
Revenue looks great but no profit? See where ecommerce profit margins leak in 2026, from returns to ad spend, and the 5 levers that fix it.

You did $80,000 in sales last month and your bank balance went down. If that sentence made your stomach drop because it is literally your situation, you are not running a broken business. You are running a very common one. In 2026 the median direct-to-consumer brand nets somewhere between 3% and 10% of revenue, and for brands under $5M in sales that number is closer to 2% to 7%. Which means a store doing $80,000 a month is often taking home the price of a used car, or nothing at all, while feeling like it should be printing money.
The revenue looks great. The Shopify dashboard looks great. The bank account tells a different story, and the gap between those two things is where most ecommerce owners quietly go broke. Let me show you exactly where the money leaks, with real 2026 numbers, so you can find your own leaks by the end of this post.
The number on your dashboard is lying to you
Open your store's analytics and it will happily show you a gross margin of 55%, 60%, maybe 65%. That number is real, and it is also useless for running your business. Gross margin only subtracts the cost of the product itself. It says nothing about the ad spend that brought the customer, the shipping label you paid for, the payment processor's cut, or the return that came back three weeks later.
Here is the uncomfortable math: the average ecommerce gross margin sits between 50% and 65%, but the median DTC brand nets just 3% to 10% after everything is loaded in. Most operators overestimate their true margin by 5 to 8 percentage points because they are watching the gross number and mentally treating it as profit. It is not profit. It is the budget you have left to pay for everything else, and everything else is expensive.
The one metric that actually predicts whether you keep money is contribution margin: what is left after every variable cost of fulfilling one order. A good contribution margin in 2026 is 20% or higher. Best-in-class DTC operators hit 25% to 35%. If you do not know yours off the top of your head, that is the first leak, because you cannot fix a number you never look at.
Where the money actually goes on a single order
Let me make this concrete with a $75 order, which is roughly the average order value for apparel and a common figure across DTC. Watch how fast the 55% gross margin evaporates.
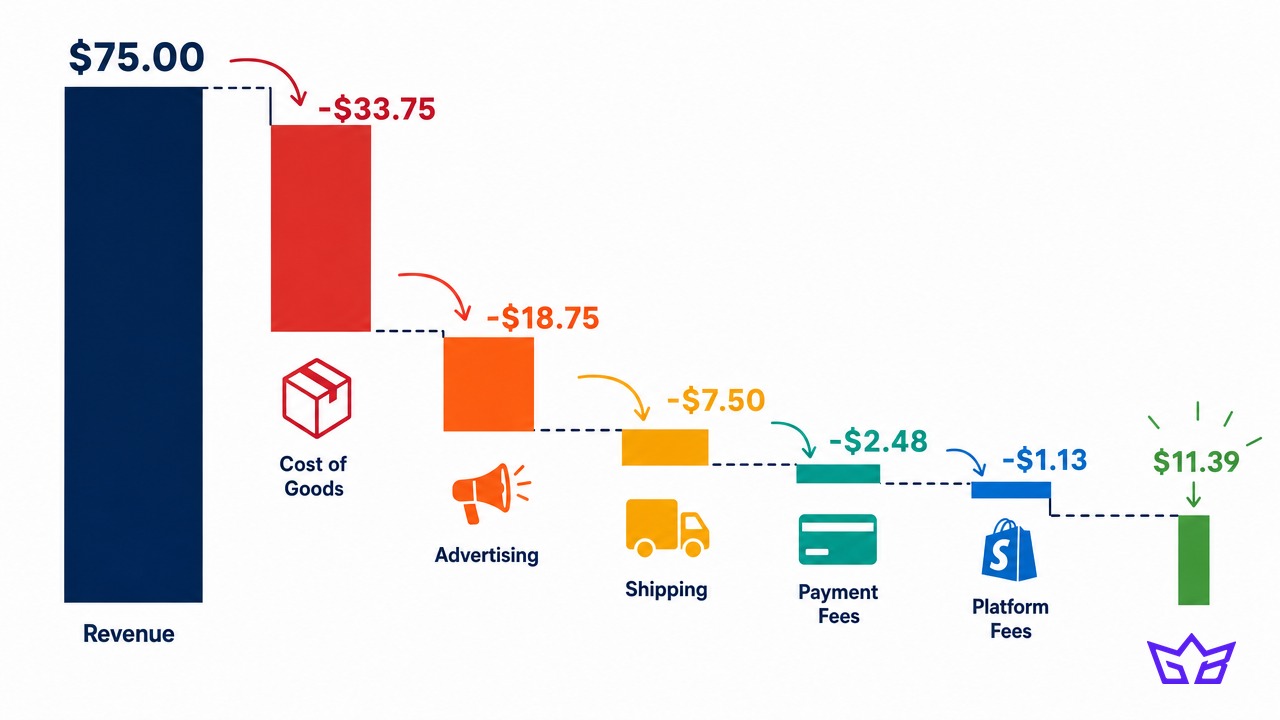
Starting from $75 in revenue on a product with a 55% gross margin, here is a realistic teardown of what leaves your account:
That $11.39 feels okay until you remember it still has to cover returns, your salary, software subscriptions, your accountant, and the loan payment. And we have not touched the single most underestimated cost in ecommerce, which gets its own section because it deserves the fear.
Returns: the cost that never shows up on your P&L
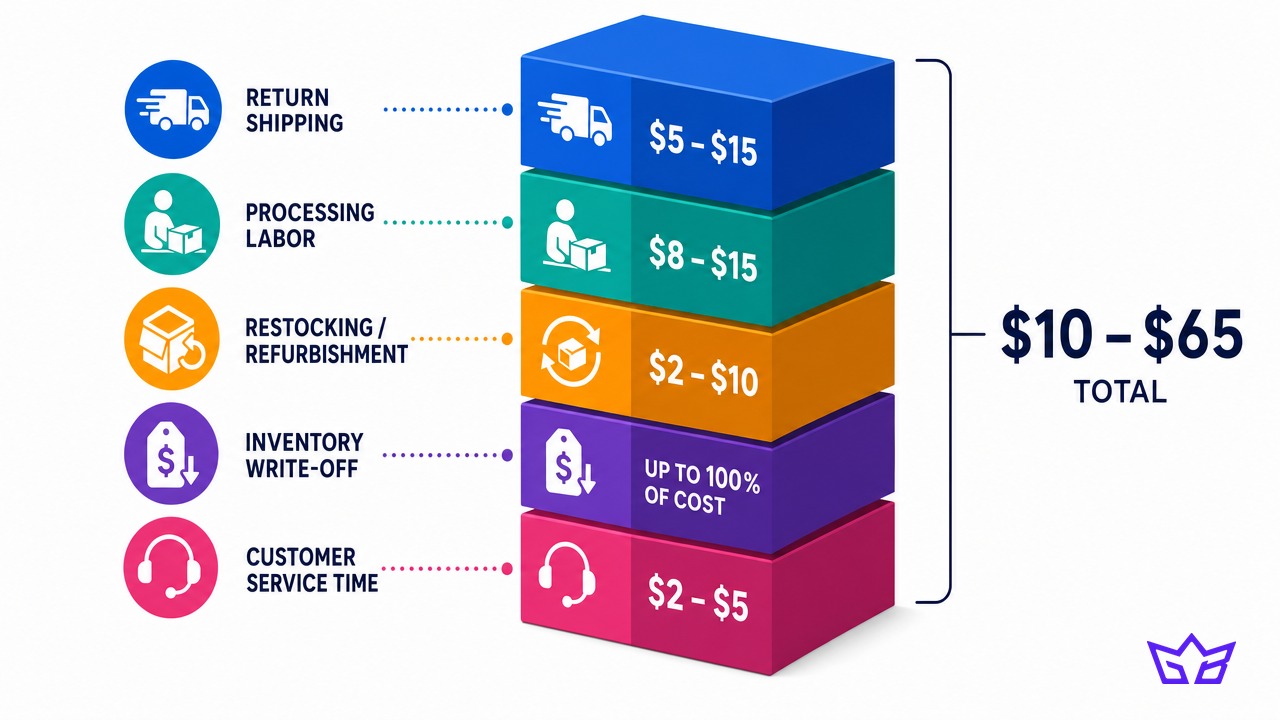
Most owners think a return costs them the shipping label. The reality is five separate costs stacked on top of each other, and together they are brutal.
The average ecommerce return rate in 2026 is 19% to 20.5% across all categories. Apparel runs closer to 25%, and can hit 40% in some sub-niches. Every one of those returns triggers a cascade:
- Return shipping: $5 to $15 to get the item back to you
- Processing labor: $8 to $15 to receive, inspect, and log it
- Restocking or refurbishment: $2 to $10 to make it sellable again
- Inventory write-off: anywhere from $0 to 100% of your cost, because only 48% of returned items get resold at full price
- Customer service time: $2 to $5 handling the email chain
Add it up and a single return costs $10 to $65 to process. Here is the part that breaks people: at a 25% return rate, returns do not shave 25% off your contribution margin. They can cut it by 70%, because you are eating the full acquisition and shipping cost on the outbound order, then paying again to take it back, then often selling it at a discount or writing it off entirely.
If you sell apparel and you have never modeled your returns as a hard cost per order, you are almost certainly overstating your profit by a wide margin. Run this one calculation today: multiply your return rate by your average processing cost, divide by your order volume, and subtract that number from every order's contribution. It hurts. Do it anyway.
The ad-spend trap: how one ROAS point flips you into the red
Advertising is now the largest variable cost for most DTC brands, eating 20% to 35% of revenue. Customer acquisition costs have jumped 40% to 60% since 2021, and the median DTC brand now spends $130 to $156 to acquire a single customer in 2026. That would be survivable if efficiency held steady. It has not.
The danger with paid acquisition is how little room for error you have. A single-point drop in return on ad spend, going from 3x to 2x, erases roughly 17 percentage points of margin. That is enough to take a healthy brand and push it underwater in one quarter, without you changing anything about the product, the pricing, or the operation. The auction just got more expensive and your margin went with it.
This is why brands that live and die on the first purchase are so fragile. If you have to be profitable on the initial order, and your CAC is $130 on a $75 order, the math simply never works. The way out is not "spend less on ads" as a blanket rule. The way out is fixing the underlying efficiency:
- Cheaper creative that converts. Polished agency ads have gotten crushed by authentic content on cost. We covered why in our breakdown of UGC versus polished ads, and the CAC implications are the whole point.
- A site that actually converts the traffic you paid for. If your paid clicks land on a slow, leaky page, you are paying full price for half the conversions. A checkout that stops leaking turns the same ad spend into more orders.
- Owned channels doing the repeat-purchase work. A repeat purchase driven by email or SMS costs cents. A new paid customer costs $130. Email is still the highest-margin channel you own, and most stores under-invest in it wildly.
Contribution margin is the only number that tells the truth
Stop looking at store-wide averages. They hide the products that are quietly bleeding you. The move that changes everything is tracking contribution margin per SKU: purchase price, inbound freight, duties, packaging, fulfillment, and ad spend attributed to that specific product.
When you do this, a pattern almost always appears. A handful of products carry the business, a middle band breaks even, and a long tail actively loses money on every sale while you keep restocking them out of habit. The rule of thumb that works:
- Products above 40% contribution margin deserve more ad budget, more inventory, and better placement. These are your engine. Feed them.
- Products between 20% and 40% are fine. Leave them alone and keep an eye on them.
- Products below 20% contribution margin need action now: raise the price, bundle them with a winner, or discontinue them outright. A product that loses money on every order does not get better with volume. It gets worse.
Most founders resist killing SKUs because the revenue feels good. Revenue is not the goal. If a product does $10,000 a month at negative contribution margin, cutting it makes you richer, not poorer. That is the entire lesson of this post compressed into one sentence.
The five levers that actually move net margin
Once you can see the leaks, here is where to push, in rough order of impact.
1. Raise your prices. This is the single most powerful action available and the one founders avoid hardest. A 1% price increase lifts operating profit by about 11% for a typical DTC brand, because it drops straight to the bottom line with no added cost. Most DTC founders are underpriced out of fear. If you are worried about losing customers, we wrote a full playbook on raising prices without losing customers.
2. Lift average order value. Getting an existing customer to spend more is nearly free margin. Set your free-shipping threshold about 30% above your current AOV (58% of shoppers will add items to hit it). Bundles lift AOV by around 55% when built well. Post-purchase upsells convert at nearly 7% and cost you almost nothing to run.
3. Attack returns at the source. Better product photography, detailed size guides, honest descriptions, and fit tools cut return rates directly. Every point you shave off your return rate flows straight into contribution margin, and it compounds because you also avoid the write-off on unsellable stock.
4. Shift revenue to owned channels. Brands that move from 10% to 30% of revenue coming from email and SMS transform their unit economics, because those repeat orders carry almost no acquisition cost. This is the single most durable margin fix, and it gets stronger every month you run it.
5. Renegotiate the boring stuff. Shipping is the silent killer. Consolidate volume, renegotiate carrier rates, and audit the apps quietly charging you monthly. Volume discounts on inventory start around 10% at 100-plus units. None of this is exciting. All of it is money.
The one-line takeaway: revenue is vanity, gross margin is a mirage, and contribution margin per SKU is the only number that tells you whether you have a business or an expensive hobby.
What to do this week
You do not need a finance degree or a new tool subscription to start. You need one honest afternoon with your real numbers.
- Calculate your true contribution margin on your top 3 products. Load in COGS, shipping, payment fees, ad spend, and a realistic returns allocation. If any of them come out under 20%, you found a leak.
- Model your returns as a hard per-order cost. Return rate times processing cost, spread across your orders. Subtract it from every order going forward. This alone reprices your entire catalog in your head.
- Find your worst SKU and decide its fate. Raise the price, bundle it, or cut it. Do one of the three before the week is out.
- Pick one owned-channel move. A welcome email flow, an abandoned-cart sequence, a post-purchase upsell. Anything that earns a repeat order without paying for it again.
We have seen this play out with our own ecommerce clients, including a retailer we took from a struggling brick-and-mortar to $84.6K online in 90 days, and the pattern is always the same. The stores that fix their unit economics grow calmly and keep their money. The stores that chase top-line revenue while ignoring contribution margin grow themselves right into a cash crisis.
If you want a second set of eyes on where your specific store is leaking, that is exactly the kind of work we do. Book a 30-minute call, bring your top-selling product and your real ad spend, and we will tell you on the call which of the five leaks is costing you the most. Better to find it now than at tax time.
Reviewed by Bahaa Zuraik under our editorial policy.